Debugging the NUnit3TestAdapter Take 2
Background
In version 4.2 of the NUnit3TestAdapter debugging has been made a bit simpler. For the earlier versions, see Debugging the NUnit3TestAdapter.
Introduction
A test adapter sits between a TestHost and the test framework. If you use Visual Studio or dotnet, both starts up a TestHost as a separate process. The testhost is responsible for locating the adapters, and then invoke them to run the test frameworks on the test code. Debugging an adapter is hard, because it sits between these two processes, of which you have no control. The way to handle this is to enable launching the adapter in debug mode. This post details how you do that.
First, debugging the adapter require you to compile and consume a debug version of the adapter. The package you debug is the nuget package.
Setting up for debugging
Create a folder to keep the nuget debug packages. We suggest you use the folder C:\nuget
Clone the adapter repository:
git clone https://github.com/nunit/nunit3-vs-adapter.git
You may choose to create a local branch, e.g. debug, but you don’t actually need to that anymore
If you prefer do:
git checkout -b debug
You will debug the adapter in Visual Studio 2019, so start up visual studio:
devenv NUnit3TestAdapter.sln
You will then need a repro project, where you have the code you want to debug. For this guide we will create it from scratch, in a folder called “Whatever”, but you will probably have your own project for this. Note however, it can be wise to create a small repro project when you’re debugging the adapter, and not use a full blown project.
In the folder for the repro/project to be debugged, create (or modify, if it exist already) a nuget.config file.
The content of the nuget.config should be like:
<?xml version="1.0" encoding="utf-8"?>
<configuration>
    <packageSources>
        <add key="local" value="c:\\nuget" />
    </packageSources>
</configuration>
(PS 1: Note the value, it should be your chosen nuget folder for debug packages.)
(PS 2: You can also add this key/value set to your global nuget.config, if you need to debug multiple projects. You can do this from inside Visual Studio, or just modify the file itself, which is located at %appdata%\nuget )
Now create the repro project:
dotnet new nunit
You can now start Visual Studio proper :
devenv Whatever.csproj
or use Visual Studio Code
code .
No need anymore to modify the adapter code for debugging
In earlier versions before 4.2, you had to modify the code. You don’t need that anymore.
However, if you plan to change something in the adapter, then you can follow the steps below here.
The only file you may want to change is the build.cake file.
In the build.cake file, go to Line 16, and add a useful modifer - it will be the preview version for the package, so something like ‘-d01’ would go fine.
Ensure you have the dash there!
If you do changes in the adapter code, you can just increment this number, for each one.
Building a debug version
Build a debug version is a two-step process, first compile it, then package it.
build -c debug
build -t package -c debug
Notice the version number created for the package, underlined red below:
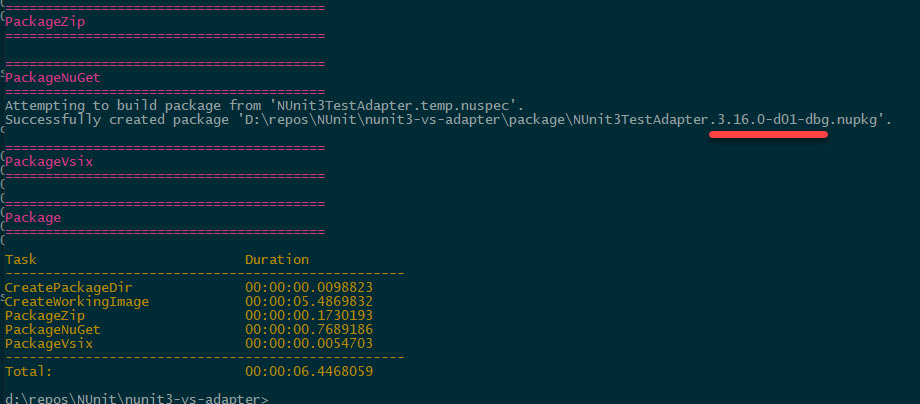
Given that your nuget folder is in c:\nuget, you can now just run the command ‘copynp’, replacing the argument with your particular package version.
copynp 4.2.0-dbg
Your debug package is now in the c:\nuget folder.
Using the debug package
Now go to your repro project, and depending on whether you use VS Code or Visual Studio, you have to add this particular package version.
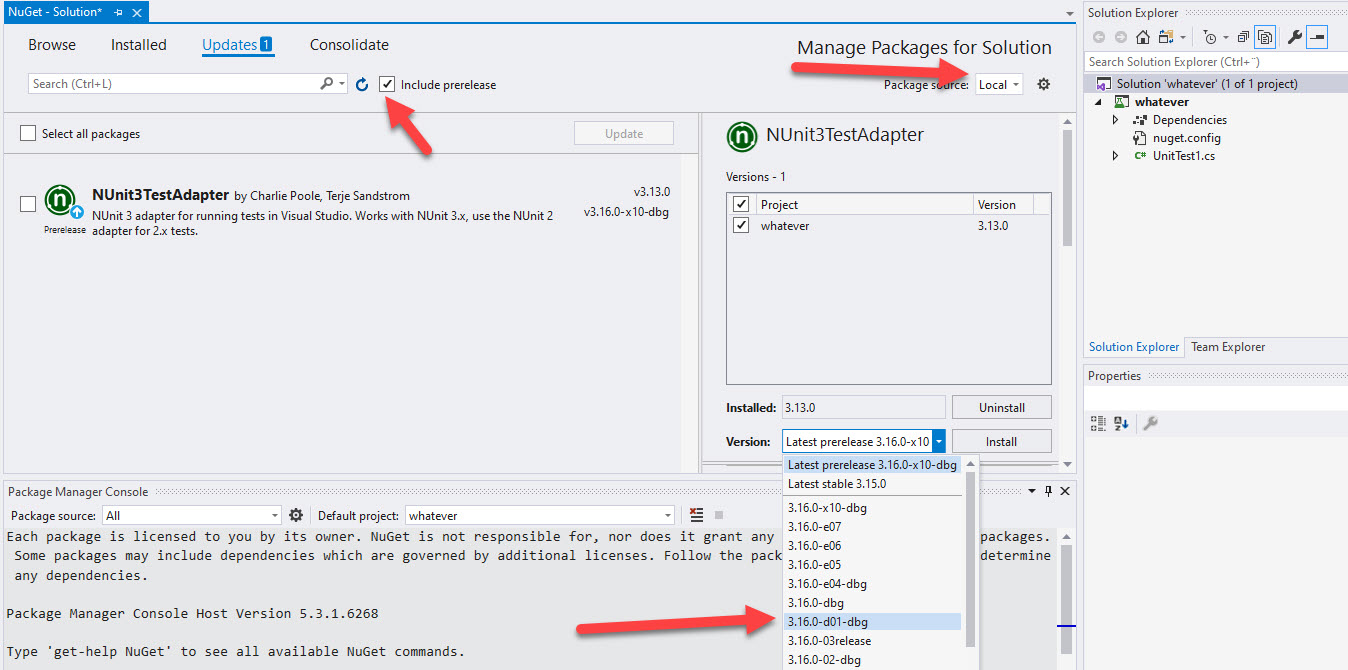
Notice that if you use the old legacy project format, then you better use Visual Studio and do the changes in the Tools/Nuget Package Manager/Manage Nuget packages for Solution…. dialog.
Remember to check the box for “Include prereleases”, otherwise you will not see it, AND of course, switch your source to Local or use All. You may have later versions, so it might look like this:
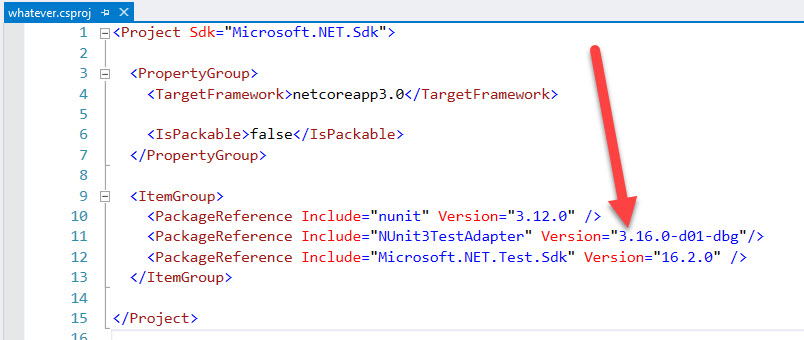
If you use the new SDK format, you can go straight into the csproj file and modify that one, although, if you have multiple files, the method above could be faster.
Starting a debug session
There are two ways to start the session, one from command line and one from Visual Studio itself.
Command line
You need to add a runsettings command to your command line, like :
dotnet test -- NUnit.DebugExecution=true
If you need to use a runsettings file for other purposes, just add the same setting there.
Visual Studio
Add a runsettings file, or a minimum one like:
<RunSettings>
   <NUnit>
       <DebugExecution>True</DebugExecution>
   </NUnit>
</RunSettings>
Then run your test, and a debug launcher will be started:
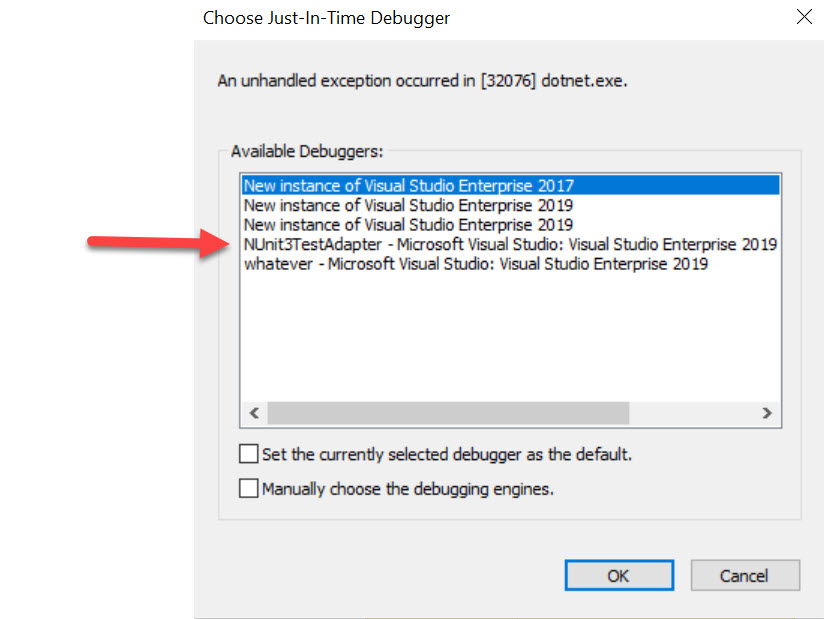
Choose the NUnitAdapter (red arrow), and off you go into the adapter code
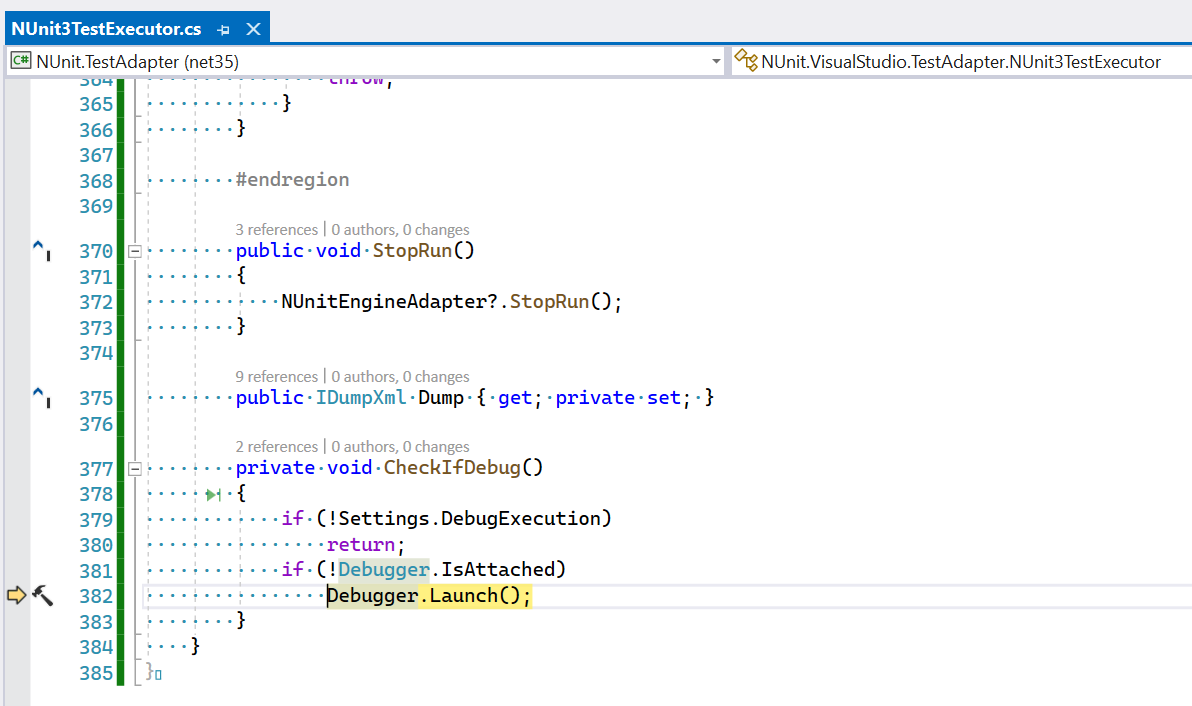
You are then inside the adapter, and the breakpoint at a Debugger.Launch statement. Step out of this method, and then you’re at the top of the Execution process, just after initialization:
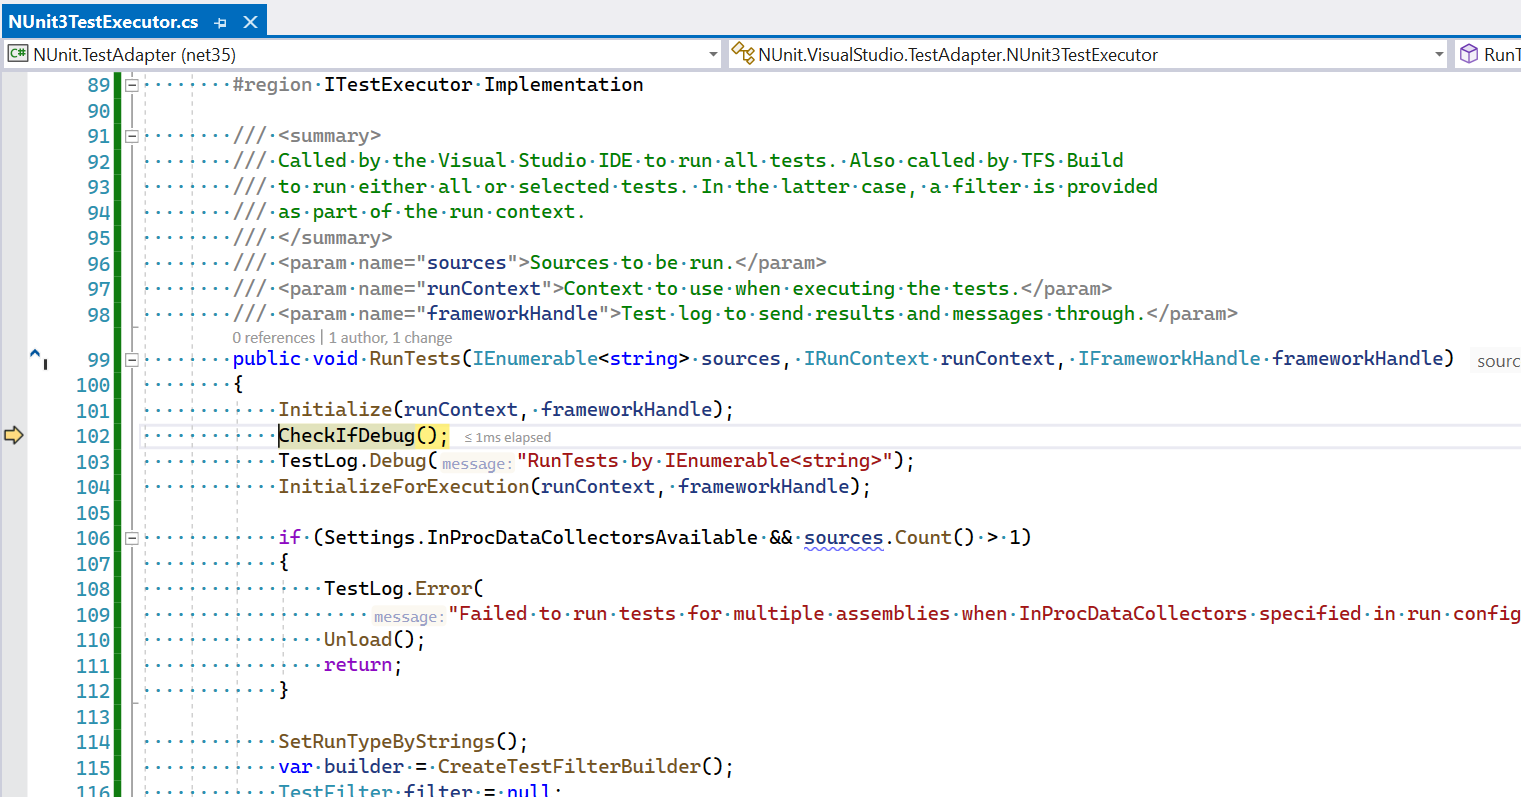
You can now set your other breakpoint, single step or whatever you need to do to figure what is going on!.
Some tricks and traps
- Don’t run this with parallell execution, it will just fire up multiple instances of Visual Studio debuggers, and you will drown in them. You can use the runsettings file to disable parallell execution if you have that issue.
- Limit the number of test cases you’re working on. Having too many can get you stuck in the internal loops in the adapter.
- Remember to use the Dump facility (enable it through runsettings, see Adapter Tips and Tricks. It shows what happens in the interface between Adapter and Framework/Engine.
- Use the Visual Studio 2019 Tools/Options/Test logging set to Trace to see what happens in the interface between the TestHost and the Adapter.
Happy debugging!